TURF: Methods for Implementation

Introduction
TURF is a long-established and useful marketing research tool, but not everyone is familiar with how it works, or with the latest applications. The purposes of this paper are: (1) to explain the technique and (2) to describe valuable methods for implementation.
An Illustration
Let us start with a product line optimization problem. Suppose the owner of a small ice cream cart wants to optimize sales by offering flavors that will appeal to the largest proportion of customers. The cart has space for 2 flavors, from which the owner can choose among 3 flavors that can be produced at equal cost. The 3 flavors are Vanilla, Chocolate, and Pistachio.

Figure 1 shows our 3 flavors in a market where each customer prefers only 1 flavor. The solution would be to offer Vanilla and Chocolate, the 2 most popular flavors, to maximize customer coverage at a sum of 50% + 30% = 80%. However, in a more realistic marketplace, there will be overlaps in customer preferences. Let us assume that preferences for Chocolate and Pistachio overlap with Vanilla as shown in Figure 2.
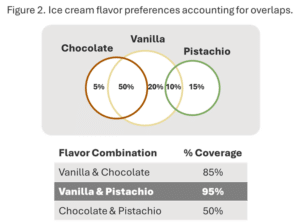
Now, offering Vanilla and Chocolate will reach 85% of customers. However, Vanilla and Chocolate is no longer the best solution. Instead, offering Vanilla and Pistachio will reach 95% of customers because many Chocolate lovers will buy Vanilla in the absence of Chocolate. We only lose 5% market share due to those preferring only Chocolate.
In practice, finding the optimal solution is not as simple as selecting the top scoring products to include in the product line. This is where an analytical technique like TURF is often implemented.
What is TURF?
TURF stands for Total Unduplicated Reach and Frequency. The analysis runs through every possible combination of products and records for each combination (1) the percentage of those that desire at least 1 product in the given combination (i.e., reach), and (2) the total number of times products are desired in the given combination (i.e., frequency).
Products like the Pistachio ice cream are referred to as niche products; they appeal to a small but unique group that otherwise is indifferent to the more popular products. While overall desire for the product is not high, there may be enough demand that when much of the market is satisfied with a couple of the top products being in the product line, the niche product reaches out to a significant remaining portion of the market. This portion of the market would have been ignored if decisions were simply based on the products with the highest preference. TURF analyzes all combinations and yields the best as those that have the highest reach value, and secondarily, the highest frequency value. It is common for top combinations to include some product(s) that did not score highly in the desirability ratings.
Traditional Practice
For implementation with survey data, TURF is typically used in conjunction with rating scales. The first and major step to applying TURF is in defining what constitutes a reach, which occurs when at least 1 of the products in a given combination is desired. Using a rating scale, say from 1 to 10, we may define a top-2 box response (a 9 or a 10) as demonstrating desire for the product, and anything less than a 9 shows no desire for the product.
While rating scales are extensively used in marketing research, their flaws are also well-known. Rating scale scores typically lack variation and hover towards the higher end of the scale (the “halo effect”). The main reason for this is that there is no comparison of products forcing the respondents to focus on both ends of the scale. Other techniques provide much better data for attribute and product comparisons. Two of these are Maximum Difference Scaling (or Best-Worst Analysis) and Conjoint Analysis.
TURF with Maximum Difference Scaling (Max-Diff)
The MaxDiff approach to measuring importance groups items into small sets and asks respondents to specify their most and least important items from each set. Because the data is focused on choices on both ends of the importance spectrum, we avoid the problematic response tendencies commonly seen in rating scales. Utility scores are then computed for each individual through a statistical procedure, such as Hierarchical Bayes, which depicts the magnitude of relative importance for each feature scaled from 0 to 100, summing to 100. [Refer to Identifying Feature Importance: A Comparison of Methods for more details]
As noted, a key step in TURF analyses is in identifying the cut-off point that signifies a strong desire for the feature (i.e., reach). In a MaxDiff exercise, one approach is to select a quantifiable cut-off, such as a score equal to or greater than 2 or 3 times the expected value. For example, if there are 10 features, the expected value of any one feature is 10, and 2 times that would be a score of 20. Alternatively, if a threshold was established to differentiate relative vs. absolute preferences, this threshold, or some multiple of it may be used. (See my blog for more details.) Now that the cut-off or reach value has been identified, data are recoded to identify each feature as either a reach or not for each respondent.
Example of TURF with Max-Diff
Take as an example a study of claims for a health product. The client wished to understand which claims were most appealing to consumers overall, and which claims should be included in marketing campaigns. A MaxDiff procedure was performed on 20 claims, followed by a TURF analysis. The reach for this study was chosen to be twice the expected value of a feature, or (100/20) ×2 = 10.
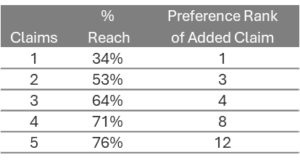
TURF results summarized: For each incremental combination of claims, the % of max reach and the MaxDiff rank of the added claim are given.
In the above table, the best combination of 2 claims reaches 53% of the sample, and comprises the 1st and 3rd ranked claims from the MaxDiff scores. When we look at the best combinations of 4 and 5 claims, the percentage reached increases by 7 and 5 percentage points when including the 8th and 12th ranked claims, respectively. In this example, TURF identified claims that appealed to niche groups but were ranked toward the middle of the pack in terms of preference overall.
TURF with Conjoint Analysis
Conjoint analysis is a technique that asks respondents to select potential products that are built using a predefined list of attributes and attribute levels. Estimation is done at an individual level via a statistical procedure, such as logit or Hierarchical Bayes, to provide utilities for each level of each attribute. These utilities, used in conjunction with a market simulator tool, are used to measure respondents’ preferences on any product of interest that can be built from the predetermined attributes and levels. [Refer to Conjoint Analysis Primer: Why, What and How for more details]
With conjoint, the attribute utilities are first used to build and simulate a defined set of products, then the subsequent simulated product preferences are used in the TURF analysis. Once the product shares are obtained, the procedure is similar as before where an appropriate reach or cut-off value needs to be identified that signifies a strong desire for the product.
Pro tip: as an alternative to the above approach, running a pseudo-TURF analysis may be beneficial. The most important deliverable from a conjoint project is often the simulator. Within the scope of the study, as bounded by the selected attributes and levels, the simulator allows you to construct any product concept(s) and estimate the percentage of respondents who would prefer it. This creates an opportunity to run a pseudo-TURF exercise that leverages simulated preference shares rather than direct stated selections. To do so, assume a market containing multiple products that are close variations of one another. First, use an optimization routine to identify the single product configuration that yields the highest individual share. Next, hold that product fixed and optimize a second configuration that maximizes the combined share of the two products. This provides the best set of two offerings under the model. The process can then be extended iteratively to identify the best set of three products, four products, and so on, depending on the desired size of the portfolio.
Example of Pseudo-TURF with Conjoint
A CPG company is trying to figure out the optimal line of products to have on a shelf when considering different attributes like count (ranging from 4 – 16), style (2 different styles), and price (based on the style and count). What is the optimal product? Is there desire for a larger count product knowing that it will be more expensive? How many overall products should we consider?
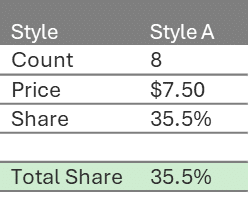
We start with iterating through all product combinations at their appropriate prices to find the single product the gets the highest share. The top product is a middle-of-the-line product that alone gets a 35.5% share.
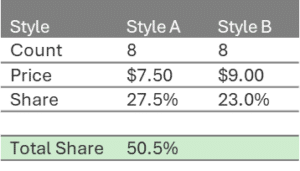
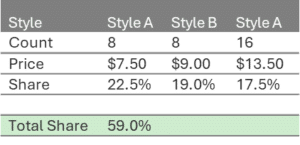
The next step is to iterate through all remaining products, but this time accounting for the inclusion of the first product. The next product that is added is a similar sized product, but this time it is in style B, which is also slightly more expensive. One interesting aspect to note regarding pseudo-TURF with conjoint is that the share of product 1 will drop. With conjoint simulations, shares will shift as new products are added. Now product 1 gets 27.5% share and product 2 gets 23.0% share for a total of 50.5%, an increase of 15.0%.
Repeat the process, but this time with product 1 and 2 included, and add a 3rd product which is another style A product. This time it is a much larger count for those who might want to buy in bulk. This leads to another increase of 8.5%.
We repeat the process and add a 4th product which is again a product of style A, but this time in a value pack.
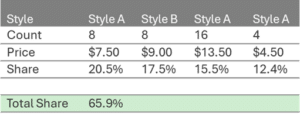
We could keep continuing to add products, but there are diminishing returns and the business has to decide when it is worth the effort to add new products and when they can justify asking for more shelf space. One other interesting aspect of pseudo-TURF in conjoint is that there are often many combinations that can lead to the total share. This can be used as a starting point and then the business can use the simulator to fine tune the optimal solution based on their needs.
Limitations and Conclusion
TURF analysis was applied in conjunction with MaxDiff and conjoint to demonstrate additional situations for utilization. TURF is a powerful tool for identifying the products to optimize a product line. It also identifies niche products that should be in the product line to appeal to most people.
A couple of its limitations have been touched upon in this paper, but are worth mentioning directly: (1) the identification of a cut-off value that specifies which products are a reach is completely subjective and may change from study to study, and (2) the percentage of respondents reached may dwindle quickly as the number of products in the combination grows.
A third and most consequential limitation of TURF involves interpretation. Standard TURF implicitly treats the items in a combination as independent choices. A respondent’s likelihood of selecting one option is assumed not to be affected by the presence of another. This makes TURF well-suited to portfolio or product-line optimization, where the goal is to assemble a set that maximizes reach. However, traditional TURF is far less appropriate for questions about bundled configurations, such as: How many consumers would adopt the product if it included options 1, 2, and 3 together? In these cases, the appeal of any component can change in the context of other components due to complementarity, redundancy, or trade-offs. Addressing such interaction effects requires methods that explicitly model preference in combination such as conjoint analysis (perhaps with pseudo-TURF).
When using sound judgment as to when and how to apply it, TURF remains a strong and useful product line optimization tool.