Constant Sum Allocation Deserves a Closer Look
July 23rd, 2025

Constant Sum Allocation Can Provide More Insight into Customer Preferences
In March 2025 , TRC partnered with The Center for Customer-Based Execution and Strategy (C-CUBES) at Rice University to field a study designed to understand the value drivers in various industries, from healthcare and banking to airlines and residential housing.1 Consumers were asked to indicate the importance they place on various value drivers using both a rating scale and a constant sum point allocation exercise. Having both importance rating scales and constant sum point allocation methodologies for the same list of drivers in each industry evaluated allowed us to compare these two methods.
Despite being commonly used in surveys, importance scale ratings can be subject to a number of issues. First, cultural bias in scale usage can make it hard to compare results across countries or subgroups. Some groups tend towards more positive scores across the board, while others are more conservative in their ratings. Additionally, repeated use of rating scales in a single survey can lead to poor respondent engagement and questionable data quality. Respondents may always use the middle of the scale instead of taking the time to consider their answers, or “straight-line” the grid with the same responses to every item in the list requiring extensive data cleaning. Finally, even when carefully used by the respondent, rating scale data may be hard to interpret if the results show average scores that are similar across the items evaluated.
Alternatively, constant sum allocation forces the respondent to prioritize their selections and consider trading off certain value drivers over others, ultimately providing more discrimination in the results. Constant sum more closely mimics the choice process in the real-world – consumers must weigh what they absolutely value and what they are willing to give up.
For example, when considering the Healthcare Providers industry, respondents were asked to indicate which of the following drivers are most important to them:
Healthcare Providers – Value Drivers
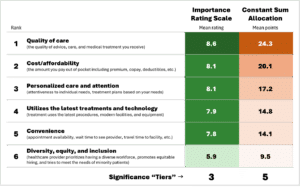
Quality of care is seen as most important regardless of methodology, however, 4 of the 5 other drivers are statistically similar with the rating scale and we are not able to definitively determine the ranking. More discrimination is clearly shown between the drivers when using constant sum allocation – there are more “tiers” among the drivers based on significant differences. We can see that Cost/affordability is more important to customers than Personalized care, and both are more important than Utilizes the latest treatments and Convenience, a level of detail that we don’t get from the importance scale ratings. For similar situations to these, it’s worth using constant sum instead of rating scales for more discrete results which can lead to better prioritization for messaging, product features, resource allocation, or other key business concerns.
Improving the Administration of Constant Sum Allocation Exercises
A common critique of the constant sum allocation methodology is the additional mental load that it requires of the respondent. It’s quite easy for a respondent to evaluate an item and click a point on a scale. However, with the constant sum exercise, they need to be aware of the total number of points they have to allocate, how many points remain, and what items they want to place more importance on relative to all the others. As a result, it usually takes longer for the respondent to complete these allocation tasks. While these concerns are certainly valid, they can be mitigated by improving the respondent experience. In this study, we took steps to alleviate some of the burden on the respondent by:
- Providing the respondent with a sum of the points entered as they answered for each driver
- Noting the number of points remaining and color coding differences from 100 points – overages in red and shortages in green
These updates to the administration of the survey appear to have reduced the time it took respondents to complete the allocation exercises (versus rating scales) by 15-20% compared to previous research.2
However, even with the changes, usage of the allocation methodology becomes impractical if the list of items evaluated grows too long. This study asked respondents to consider 6 value drivers per industry. When asking respondents to evaluate more than 8-10 items, we would recommend considering the MaxDiff methodology instead.
Conclusion
Although the rank order of the drivers is comparable between methodologies across the 18 categories in the TRC/Rice study, results show that using an allocation methodology may provide businesses with a clearer picture when trying to determine what is really important to consumers. Constant sum allocation can provide more discrimination among results that just can’t be seen using a rating scale. More importantly, it also more closely replicates the real-world choice decision process – both consumers and businesses are working with a fixed set of resources and must make tradeoffs when deciding what to prioritize. While the constant sum methodology has valid criticisms, incorporating calculations and color coding into administration of the allocation exercises can ease the burden on the respondent in terms of complexity and time to complete. All in all, constant sum allocation can be a valuable tool in the researcher’s toolbox in order to get more discrete results in consumer studies.
1A nationally representative sample of 3,063 adults was surveyed online and randomly assigned to evaluate up to three of the possible 18 industries with which they had experience.
2Chrzan, K. and N. Golovashkina (2006) “An empirical test of six stated importance measures,” International Journal of Market Research, 48, 717-40. Median time to complete ratio was 2.3 (scale ratings-38 seconds, constant sum point allocation-89 seconds). For this TRC/Rice study, median time to complete ratio was 2.0 (scale ratings-20 seconds, constant sum point allocation-39 seconds).


